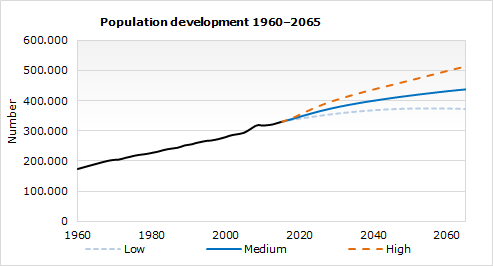
Statistics Iceland has published national projections for 2015 – 2065 which describe the size and structure of the future total population. The forecast is based on statistical models for migration, fertility and mortality.
According to the medium projection variant the Icelandic population will grow from 329 to 437 thousand persons in the next 50 years. This is due to both migration and natural increase. The high variant predicts a population of 513 thousand while the low variant projects to 372 thousand inhabitants in 2065.
The projection variants are built according to different modelling assumptions about economic growth, fertility and migration levels.
The number of births per year will exceed the number of deaths per year during the entire period, according to the medium and high variants. The low variant predicts more deaths than births per year after 2045. Life expectancy for both men and women at birth will grow from 83.5 years in 2014 to 88.5 years in 2065 for women and from 79.5 to 84.3 years for men.
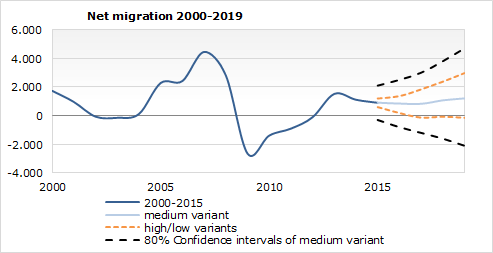
The immigration rates are expected to exceed the emigration rates, which is mainly due to foreign immigration to Iceland. The number of emigrating Icelandic citizens will continue to be higher than the number of returning citizens per year.
The short term forecast of net migration rates is based on time series modelling taking into account economic and social factors. The results are shown in figure 3, with 80% confidence intervals for the medium variant.
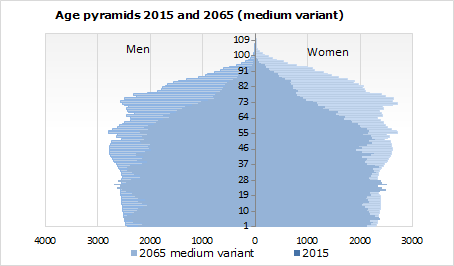
Population structure presented by age pyramids in figure 3 is predicted to change as follows:
- After 2035, the total number of men will become less than the total number of women (per year). This effect is due to the difference between the longevity of men and women. The phenomenon has been significantly postponed by the high level of male immigration during the years 2002 to 2006. The sex ratio will grow again, around 2050, reflecting the fact that the life expectancy of men is expected to rise with time.
- By 2035, 20% and by 2062 more than 25% of the population will be 65 years and older.
- After 2050, the working age population (defined as 20 to 65 years old) will have to support more people of older than of younger ages.
Population projection 2015–2065 - Statistical Series
Methodology of population projections - Working papers